MeshValmet
MeshValmet 1.2
 Description:
MeshValmet is a tool that measures surface to surface distance between two triangle meshes using user-specified uniform sampling. Thus, user can always choose finer sampling level to calculate errors in order to gain more accuracy in the “error space”, or sparser sampling to achieve speed requirement and get a general feeling of error distribution over boundaries.
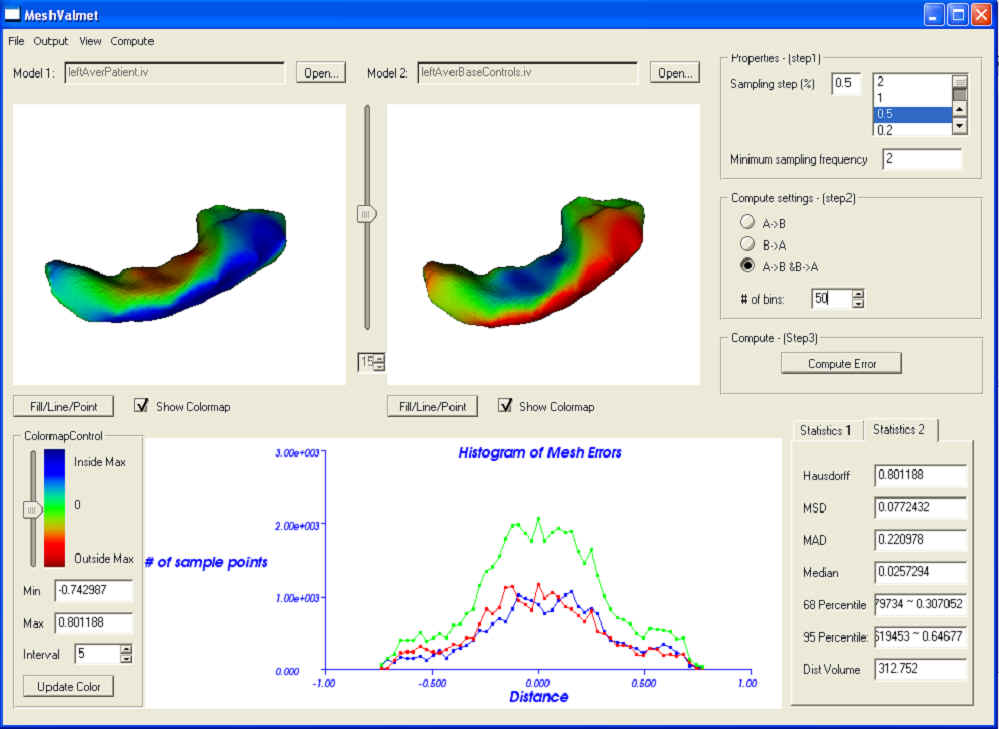
Besides its pleasant visualization using VTK library, MeshValmet also provides useful statistics and histogram information.
MeshValmet is based on the work of Nicolas Aspert, etc.: http://mesh.epfl.ch. Paper: MESH: MEASURING ERRORS BETWEEN SURFACES USING THE HAUSDORFF DISTANCE in the proceedings of the IEEE Int. Conf. on Multimedia and Expo 2002 (ICME), vol. I, pp. 705-708. Based on their code and paper, I made intense modification and added a lot of new functions.
 Features:
-
Use point to triangle closest point distance
-
User specified uniform sampling

- Space subdivision algorithm, fast computation (avoid brute force)

-
Use point to triangle closest point distance
-
User specified uniform sampling
-
Run in a batch, pipelining of statistical analysis
-
Compute the volume of shape differences
-
Provide histogram and statistical information
-
3D visualization of surface distances
 Usage:
From GUI:
- Step 1. First user has to load in two triangle meshes, currently RAW, BYU, and IV are the only three supported file format. Key “t” and “j” can switch between “trackball” and “joystick” mode in two display windows.
- Step 2. Then specify sampling step and minimum sampling frequency to be used for sub-sample the meshes, here sampling step is measure in percentage of the bounding box of the second model.
- Step 3. Choose whether you want to measure the distortion from model A->B, or B->A, or both. This is due to the asymmetric property of Hausdorff distance.
- Step 4. Click button “Compute Error”, the corresponding model would be colormapped based on the errors of the sampling points. The slider between the two windows controls display of the sampling points.
- Step 5. On the lower left of the panel is ColormapControl, where user can change the colormap properties to achieve better visual effect and gain more intuition.
From command line:
- Usage: MeshValmet [options]
-p batchFile
-s samplingStep (Default value = 0.5)
-f MinSamplingFreq (Default value = 2)
-b NumOfBins (Default value = 256)
-type computeType (Use 0 to compute the error of A <-> B,
use 1 to compute the error of A -> B, use 2 to compute the error of B -> A)
-absolute (Default value = FALSE)
-in1 inFile1
-in2 inFile2
-o outFile
Batch File Format:numOfFiles
inFile1 inFile1 outFile1
inFile2 inFile2 outFile2
…… …… ……
 Download:
| Plateform | Binaries |
|---|---|
| Windows | MeshValmet-2.1.zip , documentation |
| Windows | MeshValmet-1.2.zip , torus-sample.zip , HippoL.zip |
| Windows | Not available right now |
 Progress:
| Date | Progress |
|---|---|
| Aug. 4, 2004 | MeshValmet -1.0 completed. |
| Oct. 28, 2004 | Fix an IV-file supporting bug. MeshValmet -1.1 |
| Nov. 9, 2004 | (1) Command line batch support added.(2) Refine once again the tool, more statistics information provided. (3) More output options provided, and outputs are in an excel recognizable format.
MeshValmet -1.2 |
 Things remain to be done:
|
1. Support M3D file format, read in M-Rep models and generate mesh boundaries using Pablo library. |
|---|
| 2. Support various medical image formats, such as CT, MRI, and ANALYZE, read in images, and use marching cube algorithm to generate implied boundary meshes. |
| 3. Implement the “Synchronize Viewport” function to support viewport synchronization between the two meshes. |
| 4. A window to view the overlay of the two models. |
 Screenshot:
