Common QAQC Failures
Primer Dimer
 If primer dimer is present in a sample, a peak will be noted in the smaller bp range
(usually around 100-200 bp), in addition to the library peak. See the examples below for what this looks like in a QAQC graph.
Our sequencers can only tolerate small amounts of primer dimer
- MiSeq – up to 5% primer dimer
- NovaSeq6000 – does not tolerate ANY primer dimer

Usually if there is over 5% primer dimer in a sample, we prefer to clean up the individual library to facilitate balanced pooling. If this is the case, we may recommend a beadwash or Pippin Prep (see cleanup methods section for more details). It can be difficult to clean up in some study-made custom libraries when the library peak and primer dimer peak are very close. At that time, a study may decide to move forward with sequencing without clean up, if possible, as long as a sample exemption form is signed.
Not all libraries that show primer dimer will require clean up. If the results show primer dimer under 5% in the sample, we can pool and potentially dilute out the primer dimer with other libraries. This is a good option when there is a large number of samples in a pool. If the primer dimer persists after pooling, which is not uncommon with small sample-sized pools, we can do a beadwash on the pool without causing too much imbalance to the library stoichiometry. This method requires less money, clean ups and time.
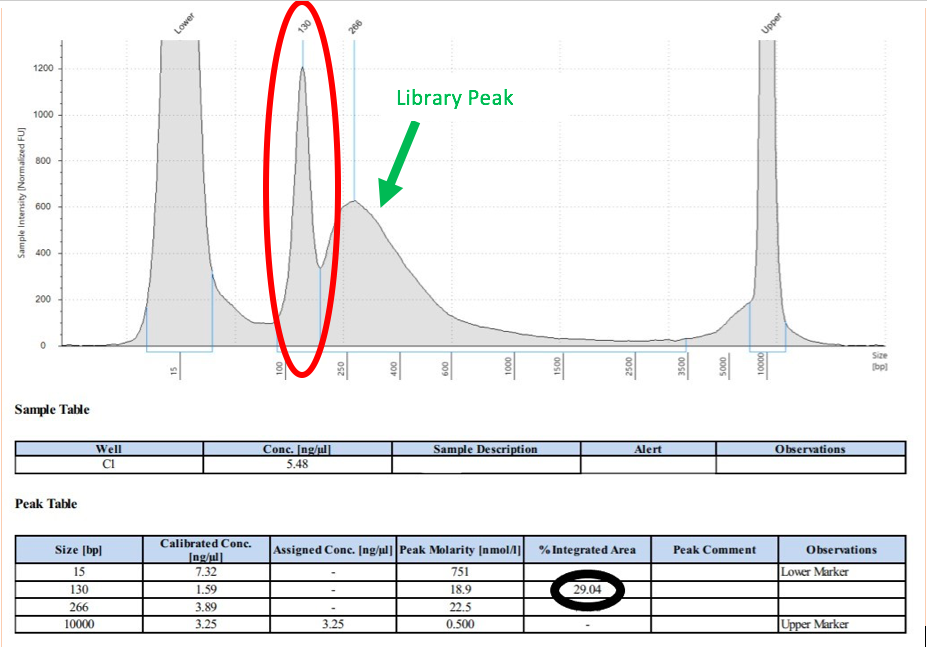
Figure 5: Primer Dimer Example from Tapestation
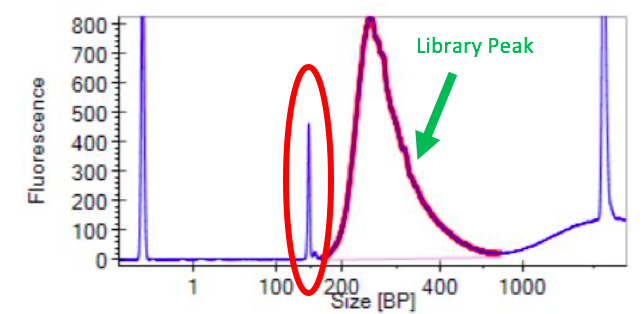
Figure 6: Primer Dimer Example from LabChip
Unexpected Peak
Sometimes, there is a peak outside the average fragment size or that is not consistent with the library type. This may indicate fragment contamination or issues with library preparation. An example of this failure is shown below. Large fragments aren’t traditionally a concern except that they can cause a Qubit reading to be inaccurate when trying to determine a loading concentration. This usually can be mitigated by multiplying the library percent under the cover by the qubit concentration to get a better estimate of library concentration. In some cases, a cleanup may be required to eliminate a contamination peak before sequencing. The latter is especially true for the HS4000 which sequences smaller fragments preferentially and will decrease data yield of the library.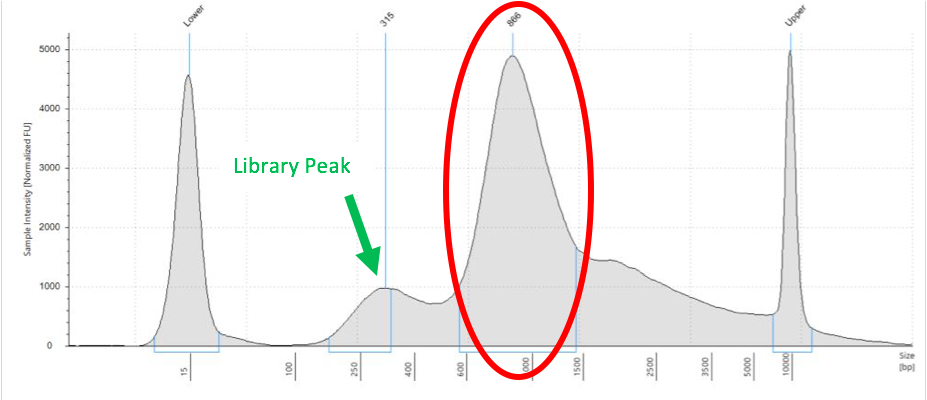
Figure 7: Large Fragment Contamination from Tapestation
Degraded RNA and DNA
When a sample of DNA or RNA breaks down into smaller fragments than originally anticipated, the QAQC results look similar to what is shown below. Generally, the closer the peak is to the lower marker peak and the larger it is, the more degradation is present.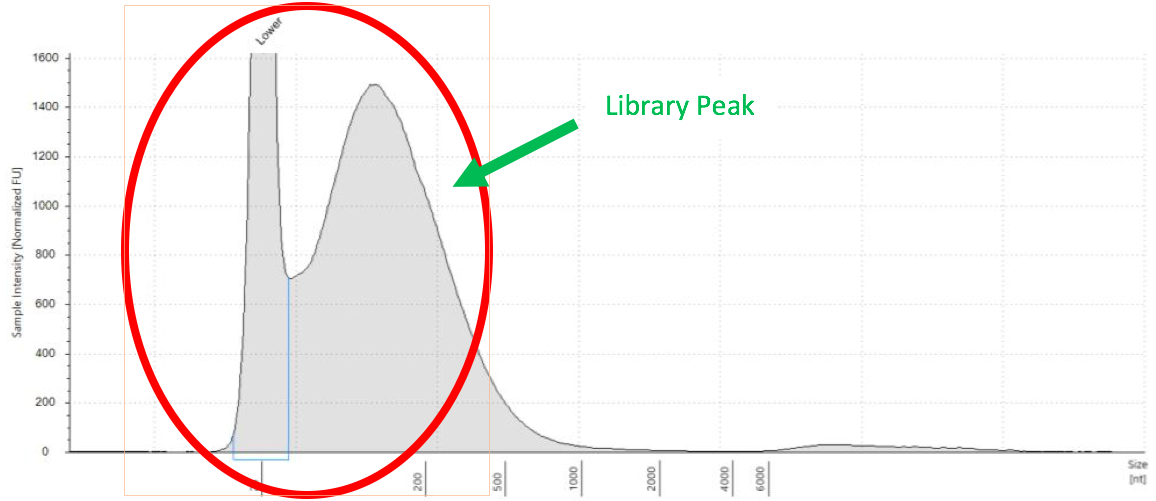
Figure 8: Degraded RNA Example from Tapestation
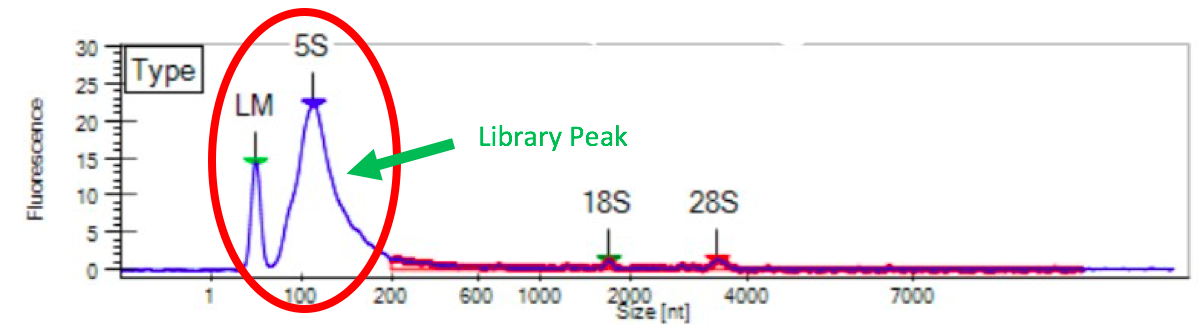
Figure 9: Degraded RNA Example from LabChip
Additionally, embedded in a Tapestation or LabChip document, a picture of what looks similar to an agarose gel can show degradation of a samples. Typically, there should be a dark, clear-cut band to show the size of a sample. When a sample is degraded, like in columns G1 and H1 in the picture below, it looks more like a smear with or without a faint band at the expected size for the material.
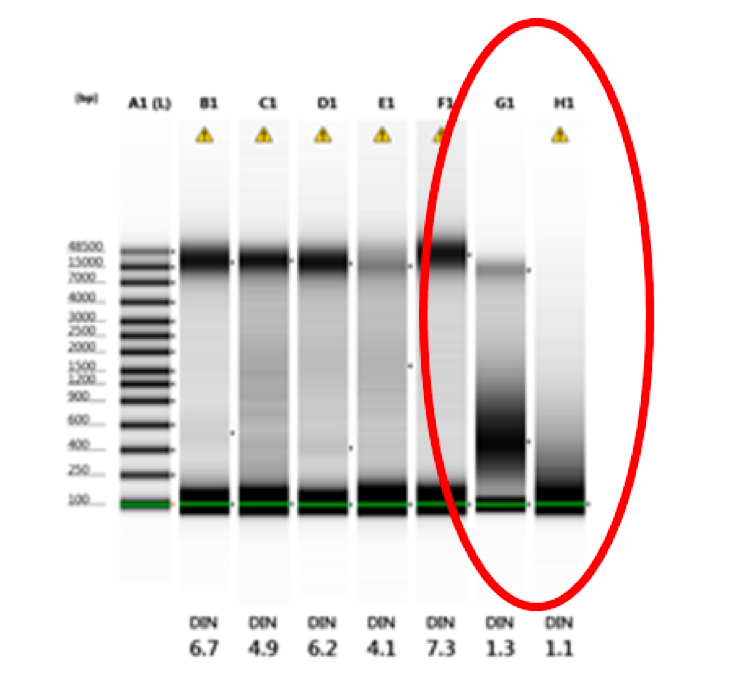
Figure 10: Degraded gDNA from Tapestration file (columns G1 and H1)