Measurements of Mucin Secretion and Mucin/Mucus Function
 |
|---|
| Figure 8. Diffusion of microbeads through HBE mucus. Movement, [i.e., mean squared displacement, Δr2(m2)] ~1μ particle is faster in normal 1% mucus than CF-like, dehydrated/thickened mucus. |
The Marsico Lung Institue has extensive experience with cell culture and freshly excised murine tracheal models to measure baseline and regulated mucin secretion. These models are coupled to a spectrum of mucin measurement technologies, including antibody/ELISA based, biochemical/UPLC – light scattering technologies, and techniques that couple both technologies.
In addition, UNC has extensive experience in measuring biophysical properties of mucus that are important for drug penetration through mucus, mucus flow, and mucus adhesion. Thus, we utilize novel thermal/Brownian motion-driven particle permeation through mucus to estimate drug/vector penetration through mucus (Fig. 8), novel measures of the mucus cohesive forces that must be overcome for effective cough, and novel measurements of the adhesion of mucus to airway surfaces that results from improper hydration of mucus (Fig. 9).
   |
|---|
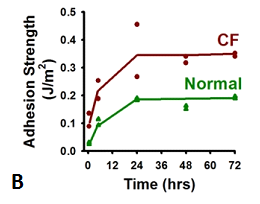
| Figure 9. A. Mucus adhesion and cohesion on airway surfaces. (i) Adhesion: The shear force of airflow leads to the creation of a crack at the interface between mucus and PCL. The energy per unit area needed to separate mucus from the PCL defines the adhesion strength of the interface. (ii) Cohesion: The energy per unit area to create a crack in mucus to separate the plaque from adjacent mucus is the cohesion strength. B. Dependence of adhesion strength on degree of hydration for normal and CF HBE cultures, measured using a novel mucus adhesion testing device. C. Cohesion strength of COPD airway mucus measured with a novel cavitation rehology device. Data represent Raw data showing critical pressures (arrows: the point at which mucus yields) of excised COPD mucus under control and treated with two different mucolytic agents. |
 |
|---|
| Figure 10. Measurement of CBF in cultured murine tracheal epithelial cells. CBF was recorded for 20 minutes to establish a stable baseline. The addition of ATP and forskolin (arrow) resulting in a rapid and sustained increase in CBF. |
 |
| Figure 11. Cilia ultrastructure. A. Diagram of a ciliary axoneme illustrating the location of hydin. B. Electron micrograph of a ciliary axoneme. C. Electron micrograph of a ciliary axoneme from a PCD patient with a central pair defect. The arrows indicate the location of a missing structure in a similar location to the position of hydin. |