Self Service Data Analytics
-
 Do you like to explore the data collected for your ongoing research project before diving into statistical modeling and hypothesis testing?
 -
Do you like to examine the clinical data extracted from the Electronic Health Records or Clinical Data Warehouse to identify trends and potential means of quality improvement?
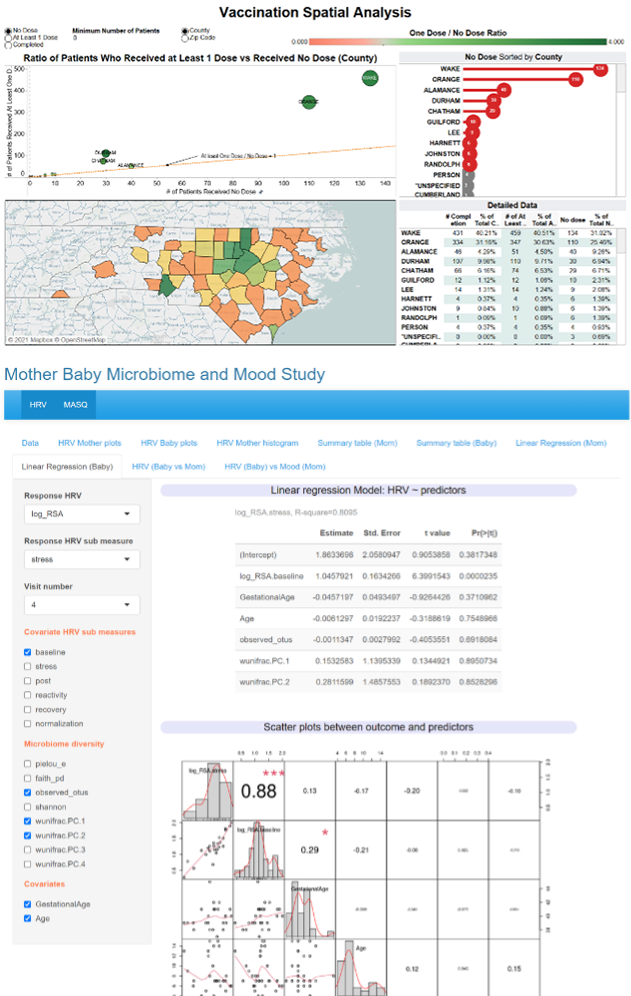
The Mental Health Informatics and Analytics core group can help build software solutions that allow clinicians and researchers to explore their research and clinical data visually and interactively. The solutions include using:
- R Shiny, a data pipeline to visualize research data before engaging in statistical modeling or hypothesis testing.
- Tableau, a state-of-the-art commercial data visualization to build dashboards to identify patterns in the data in order to improve clinical service.
These tools can effectively facilitate the self-analysis of the data as part of the exploratory data analysis process. They can also facilitate the sharing of both data and analytics processes with colleagues or other entities.
If you are interested in building a self-service data analytics platform for your project, the first step is to schedule a 30-minute appointment at the informatics and data analytics joint office hours.
Should you have any questions, please contact Dr. Xiaoming Zeng (xiaoming_zeng@med.unc.edu) or Dr. Kai Xia (kai_xiao@med.unc.edu) for more information.